

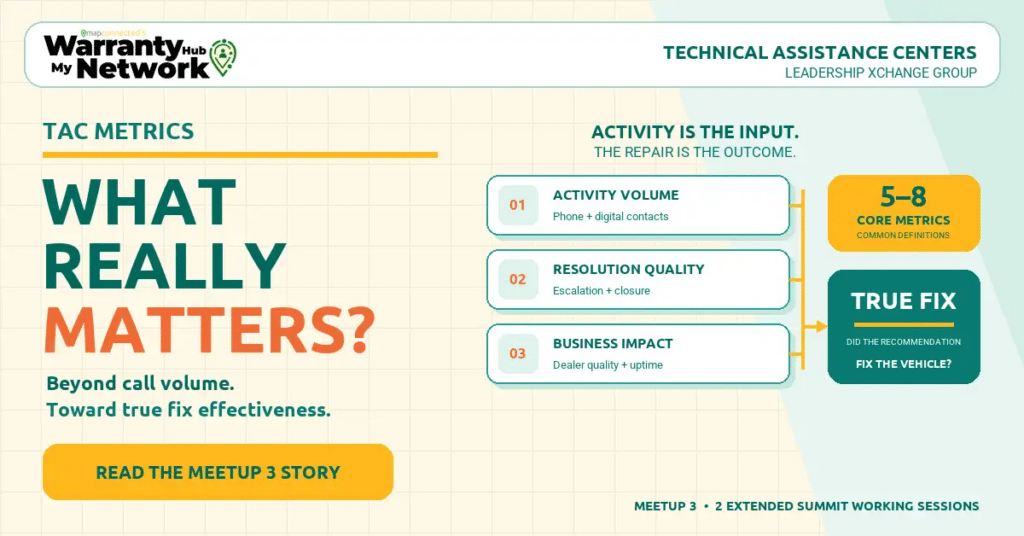
TAC metrics must measure more than call volume, response times and cases closed. The third meetup of the MAPconnected Technical Assistance Centers (TAC) Leadership Xchange Group brought OEM leaders back together around a more consequential question: How do we measure whether a TAC is truly successful?
A Technical Assistance Center is not simply processing contacts. TAC teams help technicians diagnose increasingly complex vehicles, guide repairs, support dealer operations, influence Prior Approval decisions, escalate emerging product issues and ultimately help determine whether the vehicle gets fixed right.
The discussion therefore moved beyond activity reporting toward a more meaningful framework for measuring operational efficiency, resolution quality, business impact and the experience of the technicians and dealers relying on TAC support.
TAC Metrics Must Go Beyond Phone Activity
The centerpiece of the meetup was the continued development of the TAC Metrics Benchmarking Framework. Participating OEMs reviewed the measures currently tracked across their organizations and began identifying where definitions, calculations and reporting practices differ.
Traditional phone measures still matter. These include inbound and outbound contacts, Average Speed to Answer, call length, After Call Work, abandon rates, contacts per agent and Time to Resolution.
But even familiar TAC metrics can be misleading without context.
Is a higher number of calls per agent a sign of productivity, or does it indicate that agents are moving too quickly through complex technical issues? Is a shorter handle time always better? How should phone measures be interpreted when cases increasingly move between digital communication and live conversations?
Volume alone does not define performance.
Digital Case Management Is Changing the Scorecard
Many TAC interactions now begin digitally, move to a phone conversation and then return to the case-management system for additional updates and closure. That movement makes a traditional call-center scorecard less representative of the work.
The group discussed measures including:
- Digital contacts and cases per day
- Response time and Time to Resolution
- Average touchpoints per case
- Escalation rates and Tier 2 involvement
- Case completeness and exceptions
- The overall mix of digital and phone support
- Touchpoints to resolution produced an especially useful discussion.
A case requiring 4, 5 or 6 exchanges may reflect genuine technical complexity. It may also show that critical information was missing at the beginning.
Understanding why cases require multiple contacts may become as valuable as measuring the number itself.
The Hardest TAC Metric: Did We Actually Fix It?
Perhaps the most important part of the framework focused on Resolution and Quality Effectiveness.
The group considered repeat or reopened cases, comeback rates, technician confirmation that the vehicle was repaired, escalation patterns, case completeness and single-update closures. But the larger question remains: Did the TAC recommendation resolve the vehicle concern?
That is significantly harder to measure than Average Speed to Answer.
Some organizations use technician surveys when a case closes. Others look for repeat contacts involving the same VIN and concern. Warranty data, repair histories, reopened cases and diagnostic information can also provide clues, but every approach has limitations.
A vehicle may return without creating another TAC case. A technician may not complete the closure survey. A later repair may involve a related but not identical concern.
Despite those limitations, participants agreed that True Fix Effectiveness should remain central to the benchmarking framework. If TAC exists to help technicians repair vehicles correctly, measuring whether that happened should ultimately matter more than how quickly the contact was handled.
Connecting TAC Metrics to Business Impact
The discussion also moved beyond the TAC operation itself. What impact is technical assistance having on the broader service organization?
Potential measures included dealer TAC utilization, frequent- and low-utilization dealers, escalation into engineering and quality, repair validation, Vehicle-Off-Road impact and indicators of unnecessary parts replacement.
A successful TAC may not be the one handling the most contacts. Its value may be found in reducing unnecessary contacts, improving repair accuracy, identifying dealers or technicians who need additional support and surfacing product issues earlier.
That shifts the measurement conversation from TAC activity toward operating and customer outcomes.
Different Audiences Need Different Dashboards
The same metric does not belong on every dashboard.
Executives may need a concise view of workload, responsiveness, resolution effectiveness and overall trends. TAC management requires deeper operational measures for staffing, workflows and performance. Agent-level metrics can support coaching and development. Some organizations are also beginning to share utilization and performance information directly with dealers to improve transparency and encourage better use of TAC resources.
The group distinguished between:
Metrics for executive reporting
Metrics used by TAC management
Metrics for individual coaching
Metrics shared with dealers
Metrics tracked for trends versus measures carrying formal performance targets
That separation will form an important part of the continuing benchmarking effort.
Building the MAPconnected TAC Benchmarking Core
The goal is not to create the world’s largest TAC scorecard. It is to identify the small group of measures that truly define TAC success and establish common definitions that allow meaningful cross-OEM benchmarking.
Questions still being explored include:
What are the 5–8 metrics every TAC executive should see?
How should OEMs measure true issue resolution?
How can metrics be normalized across different dealer networks, vehicle populations, staffing models and levels of technical complexity?
Which measures belong at the agent, case, contact or repair-order level?
What belongs in the MAPconnected TAC Benchmarking Core?
These questions will continue to shape the group’s work.
Two Extended TAC Sessions at the 6th Annual Summit
The TAC Leadership Xchange Group will take the conversation from virtual benchmarking into 2 extended in-person working sessions at the 6th annual Service & Warranty Lifecycle Summit in Detroit, October 19–21 plus a dedicated track.
The additional time will allow the group to move beyond identifying TAC metrics and into deeper peer discussion about how TAC organizations are structured, measured, integrated with diagnostics and quality and positioned within the broader service and warranty organization.
Topics will continue to be shaped by participating OEMs, creating time for issues that cannot be explored fully in a 75-minute virtual session.
That is the advantage of the Xchange Group model. The goal is not to leave with a polished presentation or a theoretical list of best practices. It is to compare what is happening inside different organizations, understand what works, learn from what does not and collectively build a stronger view of what the future Technical Assistance Center should measure and deliver.
Explore the 6th annual Service & Warranty Lifecycle Summit and secure tickets:
Current ticket pricing and the 25% 3-ticket bundle are available through August 31.
Explore the Other 6 Leadership Xchange Groups
MAPconnected’s confidential, member-driven benchmarking model also connects leaders across:
Warranty Administration
Purchasing & Supplier Cost Sharing
Parts Return & Quality Analysis
Field Services Connected Data
Recall, Legal & Compliance
Financial Products & Insurance
Click here to learn more about MAPconnected membership and Leadership Xchange Groups:
The TAC Leadership Xchange Group is showing that the conversation is no longer only about answering calls. It is about building a technical-support operation that is measurable, scalable, data-driven and focused on the outcome that matters most: helping get the repair right.
Stay Connected
Subscribe to receive MAPconnected insights and MyWarrantyNetwork CONNECT.
Follow MAPconnected on LinkedIn for Xchange Group insights, Summit announcements and practical perspectives across the Service & Warranty Lifecycle: